
Whether you already own a home or are thinking about buying, keeping up with home prices can feel confusing. One headline says prices are falling, while another reports they’re still rising.
So, which is it? The answer depends largely on where you live.
At Benson & Mangold Real Estate, we know that understanding the housing market starts with looking beyond national headlines and paying attention to what’s happening in your local community.
What’s Really Happening With Asking Prices?
Some recent headlines have focused on declining asking prices, but there’s more to the story. Seasonal trends, inventory levels, and mortgage rates all play a role in how sellers price their homes.
According to HousingWire Data, the number of homes on the market has reached its highest level since November 2019. With mortgage rates rising since the spring, some homes are taking longer to sell, prompting sellers to price more competitively.
The national median asking price has declined from approximately $449,000 in early August to $435,000 two months later.
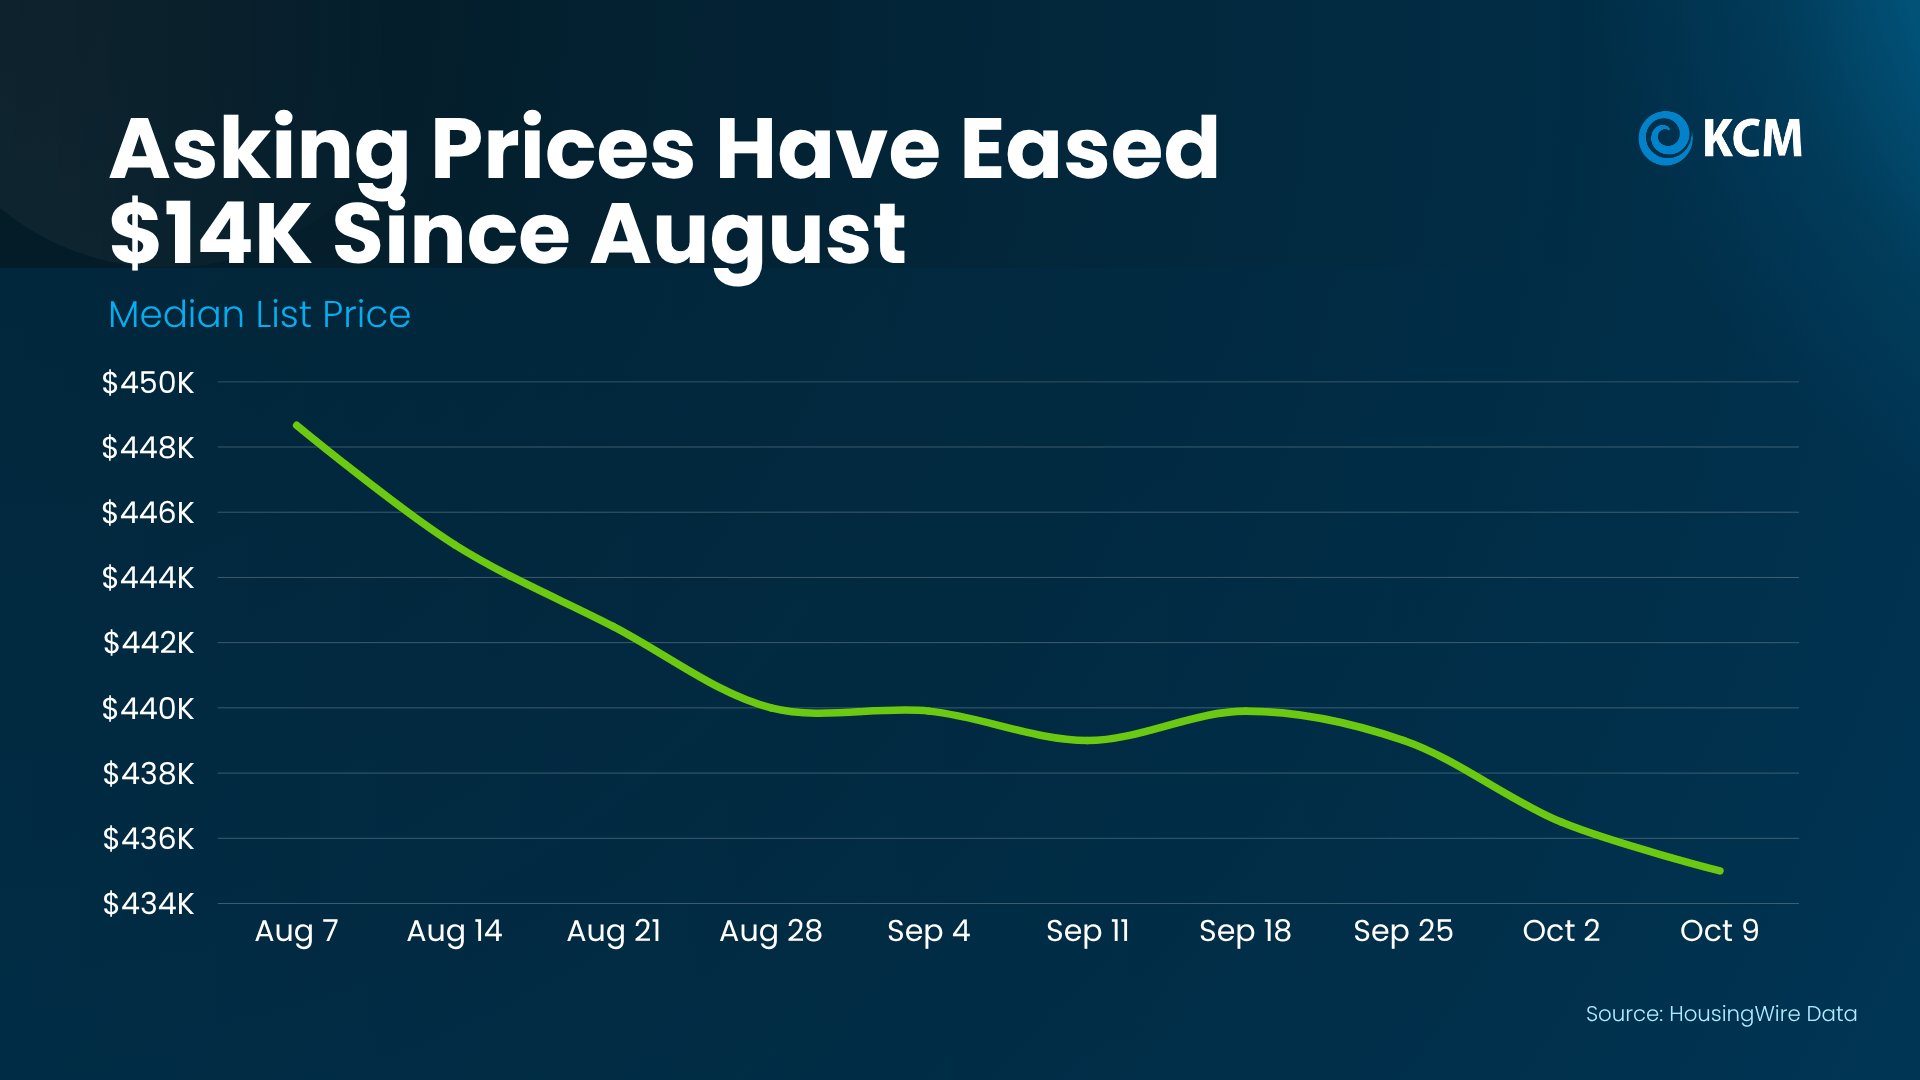
The national median asking price declined from $449,000 in early August to $435,000 in October 2026. Source: HousingWire Data.
That’s a decrease of about 3%, but seasonal trends help put the change into perspective. Asking prices often cool in the fall as the busy summer selling season winds down and buyer activity shifts.
Mortgage rates and affordability also influence pricing decisions. In a more competitive market, sellers may need to adjust their expectations to attract buyers and generate offers.
However, national asking-price trends don't tell the whole story. Asking prices reflect what sellers hope to receive, not necessarily what buyers ultimately pay. To understand what a home is worth, it's important to look at recent comparable sales and current market conditions in your area.
Why Location Matters More Than the Headlines
Housing markets can look very different from one city or region to another. Even when national trends point in one direction, local home values may be moving differently depending on inventory, buyer demand, property type, and price range.
Recent data from the S&P Cotality Case-Shiller Home Price Index illustrates this variation. Over the past year, home prices in Chicago increased by nearly 7%, while Seattle experienced a decline of approximately 1.6%.
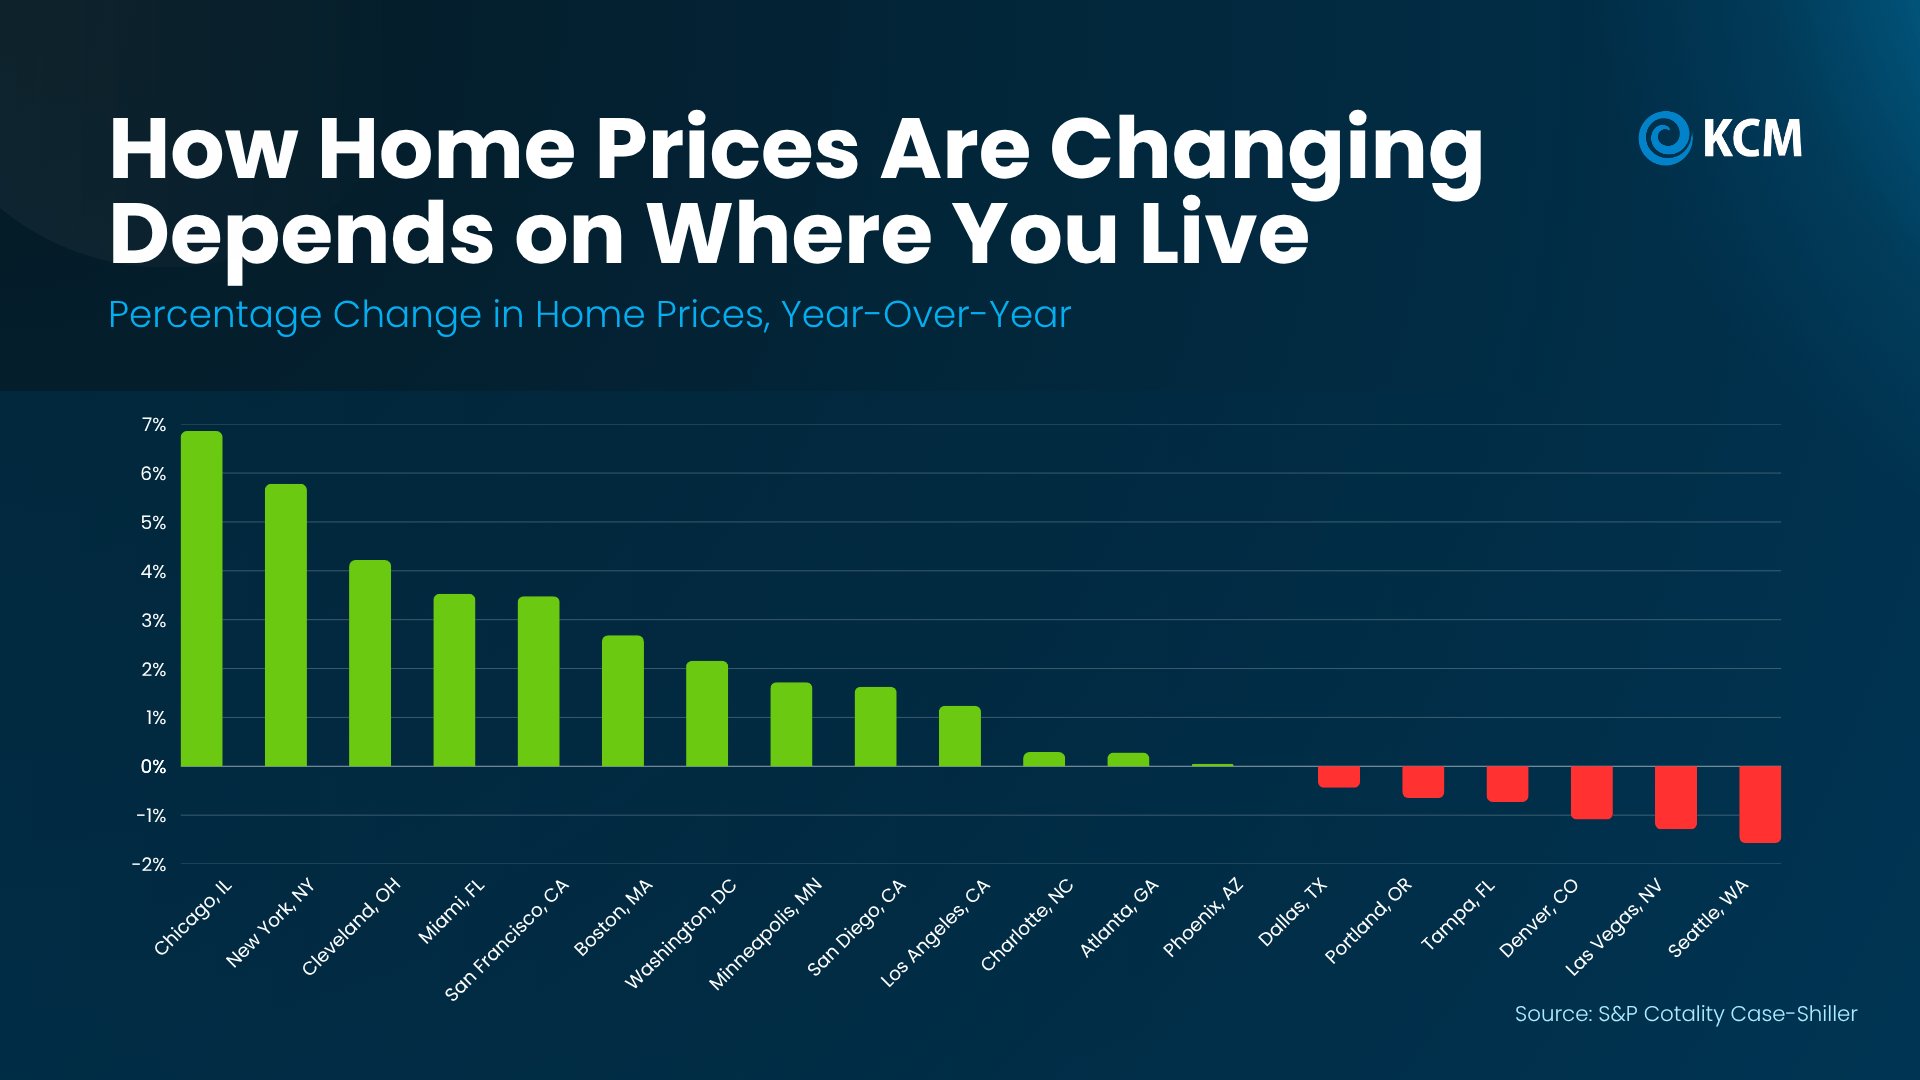
Annual home price changes vary significantly by market, highlighting why national averages don't tell the entire story. Source: S&P Cotality Case-Shiller Home Price Index.
These differences can influence the decisions buyers and sellers make. In a market where prices are rising and inventory is limited, sellers may have more leverage. In areas where inventory is higher and prices have softened, buyers may have more opportunities to negotiate.
Here on Maryland's Eastern Shore, the same principle applies. Market conditions can vary between communities, property types, and price points. Waterfront homes, historic properties, and homes in established neighborhoods may each attract different buyers and experience different levels of demand.
That's why working with a local real estate professional matters. Understanding recent sales, available inventory, and buyer activity in your specific market can help you make informed decisions rather than relying on national trends alone.
Do Declining Prices Mean a Housing Market Crash?
It's understandable to wonder whether reports of falling home prices signal a larger downturn. However, modest price declines in some markets aren't the same as a widespread housing crash.
The recent declines highlighted in the national data are relatively small compared with the significant losses experienced during the 2008 housing crisis. Market conditions today also differ from that period, and price movements vary considerably by location.
Long-term home price data provides additional perspective. According to the Federal Housing Finance Agency (FHFA), national home prices have recorded year-over-year growth in every quarter since 2012.
Looking further back, FHFA data shows how home values have changed over time, even when accounting for major market downturns. A home valued at $100,000 in 1991 would be worth approximately $436,000 today based on the historical appreciation example provided in the original data.
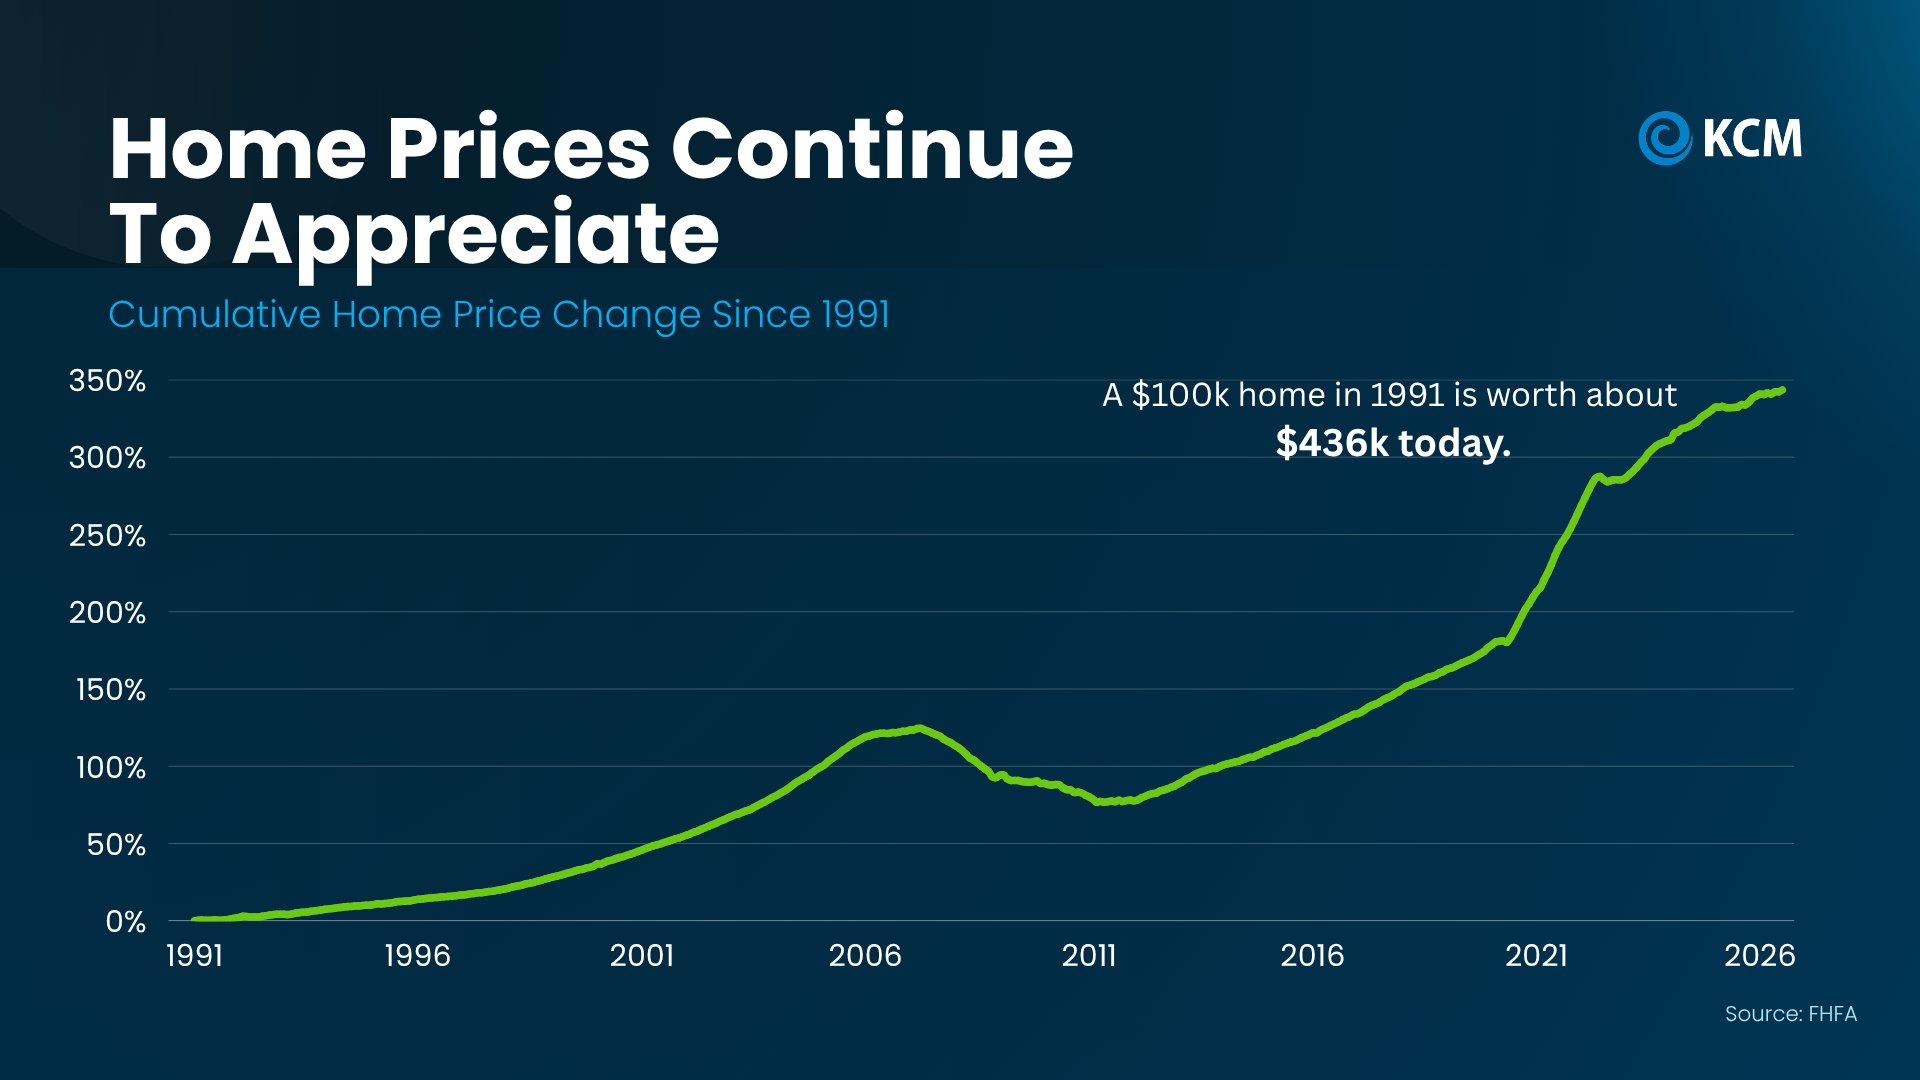
Long-term home price trends demonstrate how values have changed over time, including through periods of market correction. Source: Federal Housing Finance Agency (FHFA).
Past appreciation doesn't guarantee future price increases, and no two market cycles are exactly alike. Still, long-term trends reinforce the importance of taking a broader view rather than interpreting every short-term price adjustment as a sign of a housing crisis.
For buyers and sellers, the most useful question isn't simply whether national prices are rising or falling. It's how current conditions affect the property and market they're considering.
The Bottom Line
National headlines can offer a glimpse of broader housing trends, but they can't tell you exactly what your home is worth or how much negotiating room you may have as a buyer.
At Benson & Mangold Real Estate, we believe local knowledge makes the difference. With deep roots on Maryland's Eastern Shore and experience across the Mid-Shore, our agents can help you understand current market conditions, evaluate comparable sales, and develop a strategy that fits your goals.
Whether you're preparing to sell, searching for your next home, or simply curious about your property's value, we're here to help you navigate the market with confidence.
Thinking about buying or selling on Maryland's Eastern Shore? Connect with Benson & Mangold Real Estate to discuss what's happening in your local market.